DGX Station GB300 Qwen Tests Show Large Throughput Differences Between Quantized Models
Eight Qwen checkpoints reached very different throughput on the DGX Station GB300; quantization alone didn’t predict performance under load.
On the DGX Station GB300, choosing a smaller Qwen checkpoint didn’t guarantee higher throughput. In tests of eight Qwen3.8 and Qwen3.6 versions, the two NVFP4 releases of Qwen3.8-27B delivered the strongest throughput under heavy load, while other reduced-precision versions lagged their BF16 counterparts. The results make the checkpoint publisher and model architecture as relevant as the number format.
The measurements cover three models: dense Qwen3.8-27B and Qwen3.6-27B, plus the mixture-of-experts Qwen3.6-35B-A3B. Each ran in BF16 and one or more lower-precision versions. The system was an NVIDIA DGX Station GB300 with 288 GB HBM3e.
Benchmark setup and limits
The test used vLLM v0.29.0, with each model in its own container and 40% of GPU memory assigned. AIPerf, driven by the aiperf_tool harness, sent requests with a 1,024-token prompt and exactly 512 output tokens. Prompts could be slightly longer after applying each model’s chat template. Each load level ran for five minutes and was measured twice; requests continued as soon as the previous response finished.
Load levels were 1, 4, 16, 32, 64 and 128 concurrent requests. The five FP8 and NVFP4 checkpoints were also tested at 256; BF16 runs stopped at 128. The benchmark reports total output tokens per second, response streaming speed per request and time to first token (TTFT). It used no speculative decoding and measured no answer quality, so these results don’t establish whether quantized versions preserve the quality of BF16 outputs.
BF16 stores each weight using 16 bits, FP8 uses 8, and NVIDIA’s NVFP4 format uses 4 bits plus scaling data. Smaller weight files can reduce the data read from memory for each generated token and leave more of the allocated memory available for the KV cache, which stores active request context. The repository sizes ranged from 20 GB for NVIDIA’s Qwen3.6-27B-NVFP4 to 67 GB for BF16 Qwen3.6-35B-A3B.
One comparison has an extra configuration difference: NVIDIA’s NVFP4 Qwen3.6-35B-A3B used --attention-backend flashinfer and --moe-backend marlin. Its results therefore don’t isolate the effect of precision alone. All other versions used the same stated memory limit and vLLM version.
Dense 27B models diverged under load
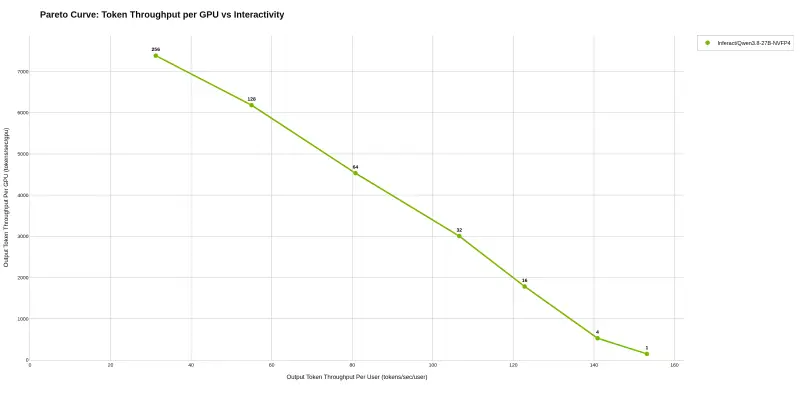
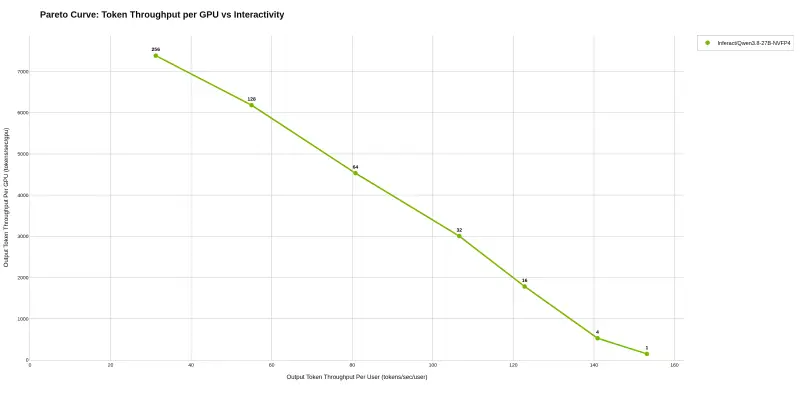
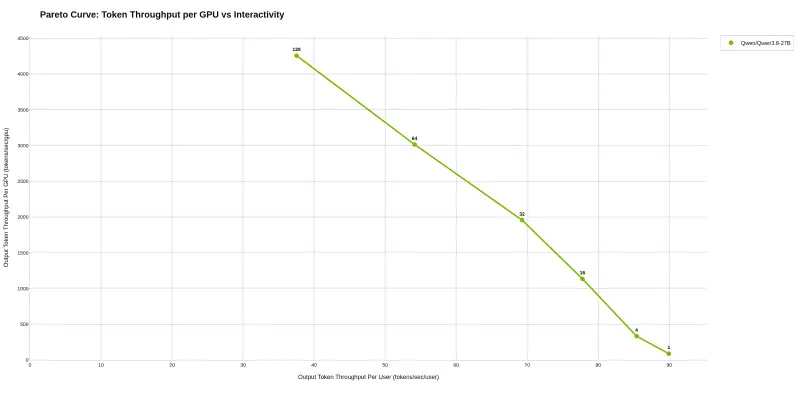
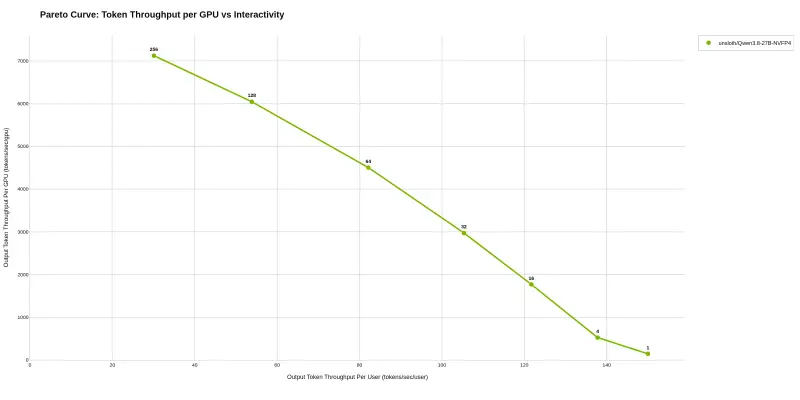
For Qwen3.8-27B, reduced precision increased single-request streaming speed. BF16 reached 89.9 tokens per second, compared with 111.5 for FP8 and 150.0 to 153.2 for the two NVFP4 versions. Their behavior changed as concurrency rose. At 32 requests, Inferact and unsloth NVFP4 produced 3,005 and 2,973 tokens per second in total. At 128, they reached roughly 6,000 to 6,200, about 42% to 45% above BF16’s 4,257 at that level. Their peaks came at 256: 7,384 for Inferact and 7,123 for unsloth.
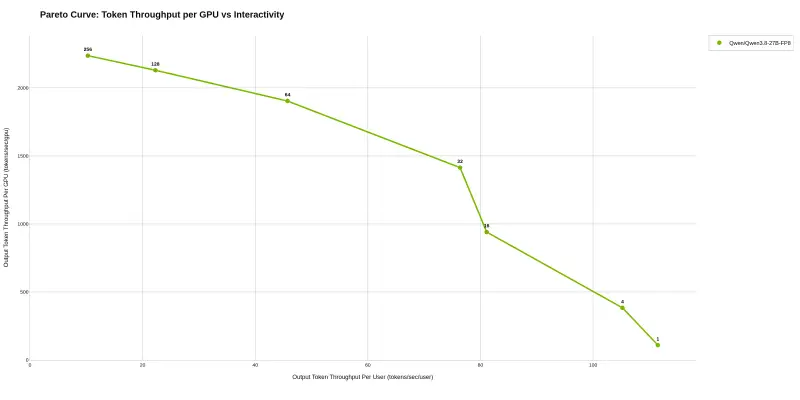
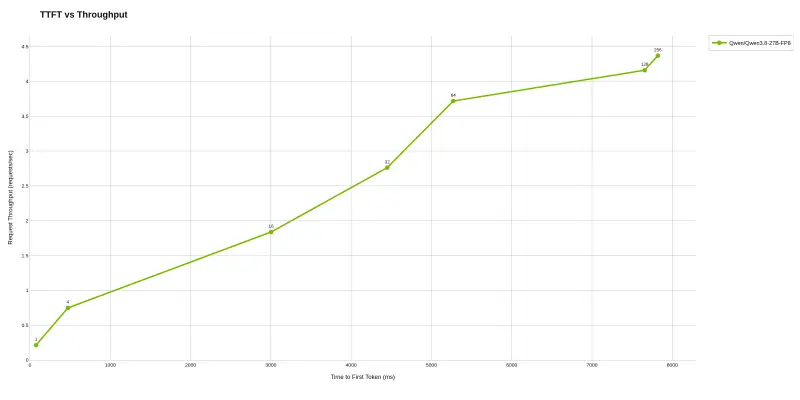
Qwen3.8-27B-FP8 followed a different pattern. Its total throughput was below BF16 from 16 concurrent requests onward, reaching a peak of 2,237 tokens per second at 256. TTFT also climbed sharply: 2.33 seconds at 16 requests and 4.43 seconds at 32. BF16 measured 0.62 and 1.03 seconds at those loads, while the two NVFP4 versions were around 0.42 and 0.67 seconds. That contrast matters for services where users notice the wait before the first streamed token, even if aggregate throughput is the main capacity measure.
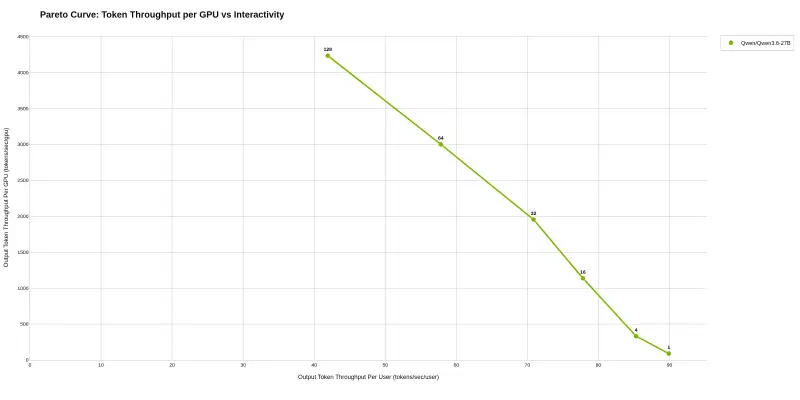
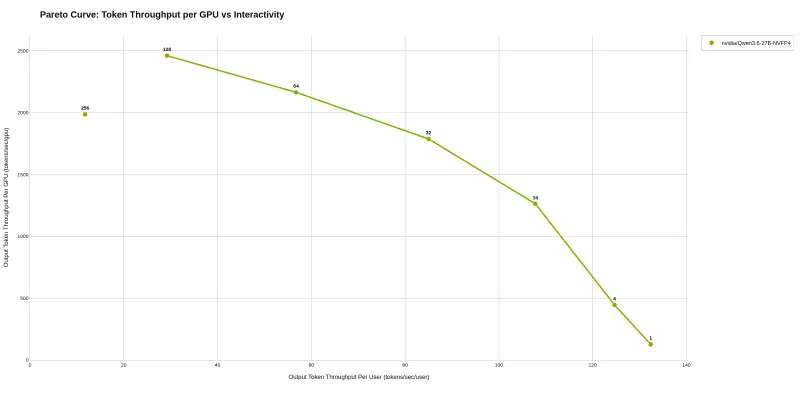
The BF16 versions of Qwen3.8-27B and Qwen3.6-27B performed almost identically across the measured loads. NVIDIA’s NVFP4 Qwen3.6-27B, however, reached 132.4 tokens per second for one request, above BF16’s 89.9, then fell behind as concurrency increased. At 32 requests it delivered 1,787 tokens per second against BF16’s 1,955; its peak was 2,461 at 128, compared with 4,236 for BF16. TTFT reached 1.72 seconds at 16 and 3.10 seconds at 32. At 256 requests, its total throughput was 1,986.
Mixture-of-experts results were closer
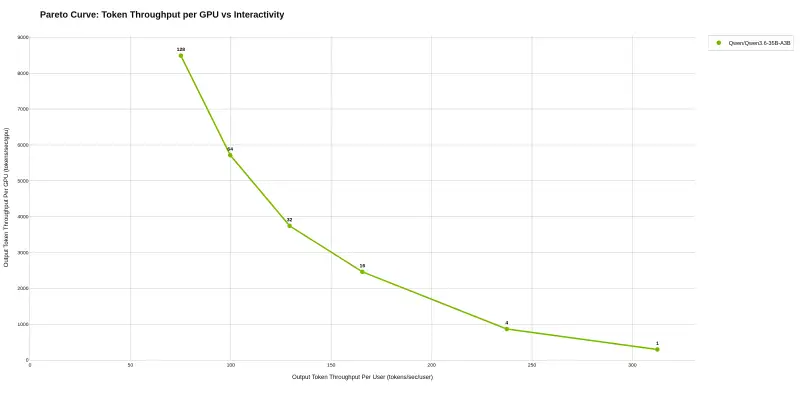
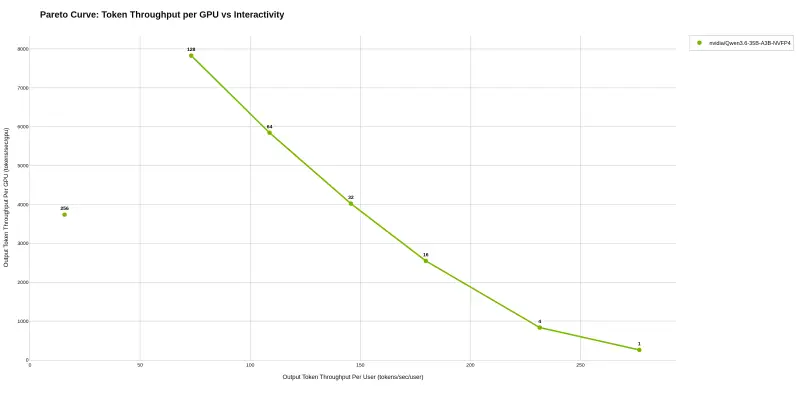
Qwen3.6-35B-A3B activates about 3 billion of its 35 billion parameters for each token. BF16 led on a single request, at 312.4 tokens per second versus 276.7 for NVFP4, and had the higher peak total throughput at 128 requests: 8,491 against 7,828.
At intermediate loads, NVIDIA’s NVFP4 version edged ahead in total throughput: 2,549 versus 2,459 tokens per second at 16 requests, 4,021 versus 3,742 at 32, and 5,845 versus 5,713 at 64. At 256, its throughput fell to 3,738; there’s no BF16 result at that load for comparison. Across the tested levels through 128, the two versions stayed within about 12% in total throughput.
Reading the curves and choosing a checkpoint
The accompanying Pareto charts plot total output throughput against the streaming speed of one response. Each point represents a concurrency level; the connected frontier marks loads that aren’t beaten on both measures by another point. For example, Inferact’s Qwen3.8-27B-NVFP4 produced about 153 tokens per second for one request, then about 31 per request and 7,400 total at 256. Axes are scaled separately for each model, so numeric values are needed for comparisons across charts.
At 128 requests, the Inferact and unsloth Qwen3.8 NVFP4 checkpoints produced substantially more total output than BF16. By contrast, Qwen3.8 FP8 and NVIDIA’s Qwen3.6-27B NVFP4 reached only about 50% to 60% of their corresponding BF16 throughput at that level, alongside rising TTFT. For the mixture-of-experts model, the two formats stayed much closer.
The cause of these differences wasn’t investigated. The recorded vLLM metrics show the KV cache wasn’t full in the cited high-load cases: at 128 requests it was at most 51% full for Qwen3.8 FP8 and 33% for NVIDIA’s Qwen3.6-27B NVFP4; at 256, those figures were 84% and 66%. No request was preempted.
The data and configuration files are available in the aiperf_dgx_station_260918 repository. These are synthetic, fixed-length workloads from two runs per load level on vLLM v0.29.0. Newer server versions, checkpoint releases, or real prompts and response lengths could change the ranking. For a deployment choice, the clearest next step is to compare candidate checkpoints with the intended workload and assess both throughput and first-token delay.
 AMD Venice Uses 2.5D Packaging to Feed More Bandwidth Into EPYC Zen 6
 CNC Controller Board Design: Interfaces, PCB Specs and Assembly Testing
 Stratasys and Nano Dimension End $42.5 Million Markforged Sale Agreement