Trainium3’s PyTorch Shift Brings Flexible Training and Fine-Grained Profiling
TorchNeuron brings familiar PyTorch workflows to Trainium3, with promising training results and detailed profiling, while compile delays remain a key hurdle.
Trainium’s case for research training now rests on two practical changes: a PyTorch workflow that feels more familiar to researchers, and a profiler that exposes hardware activity in unusual detail. Early Trainium3 testing suggests both could make the accelerator easier to use for model development. The software still has rough edges, especially long compilation times, and its ecosystem has a long way to go before matching CUDA’s maturity.
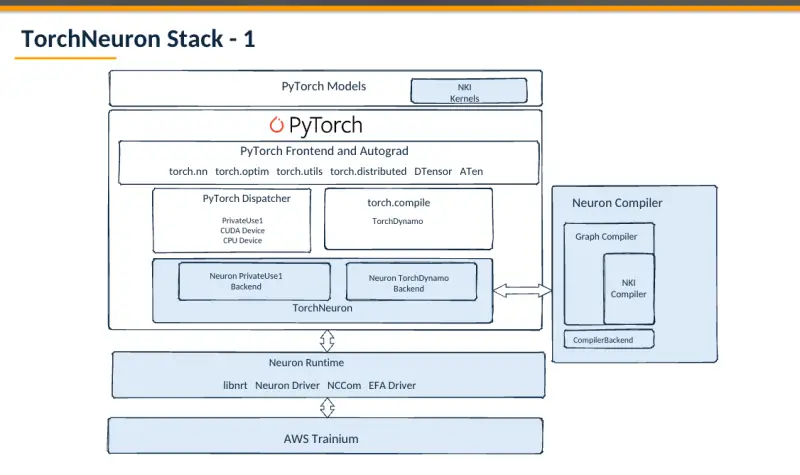
AWS’s Neuron team is shifting from adapting PyTorch to Trainium toward a native PyTorch experience. With TorchNeuron, users can run eager mode, use torch.compile and call standard PyTorch APIs. That removes much of the friction associated with the earlier PyTorch/XLA approach, which relied on lazy graph capture and often required changes to training code.
That distinction matters more in training than inference. Production inference tends to use a limited set of established model architectures, while research teams frequently alter models and run ablations. They need broad operator support and a software stack that accommodates changes without forcing them to rewrite the training loop each time. Trainium has already been used for production inference and reinforcement-learning rollouts at Anthropic, including on Trainium2 and Trainium3. The new effort aims to make it more useful across the less predictable demands of research.
PyTorch workflow and library support
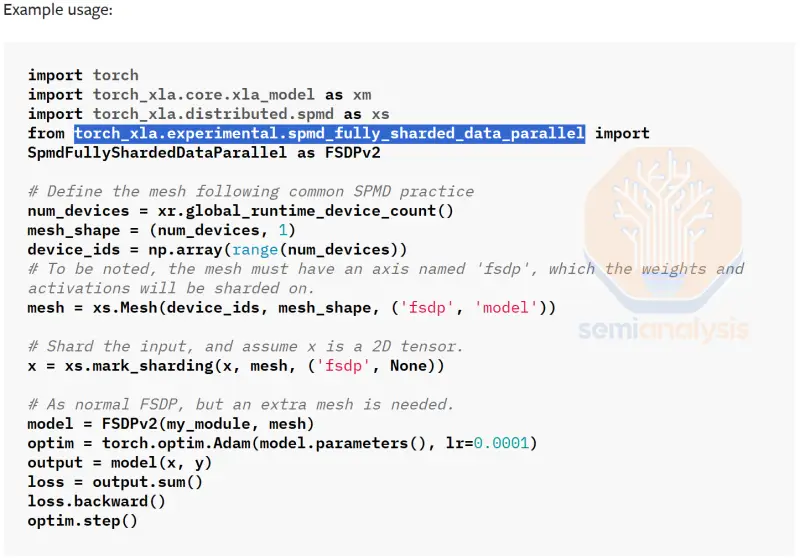
In the former workflow, PyTorch/XLA had no first-class eager mode and lacked native support for PyTorch’s distributed and parallelism APIs, including torch.distributed.*, DTensor, SimpleFSDP and DDP. Users instead had to work with XLA-specific interfaces such as torch_xla.experimental.spmd_fsdp and torch_xla.distributed.spmd. Researchers accustomed to CUDA therefore had to learn a different way to write and structure training code.
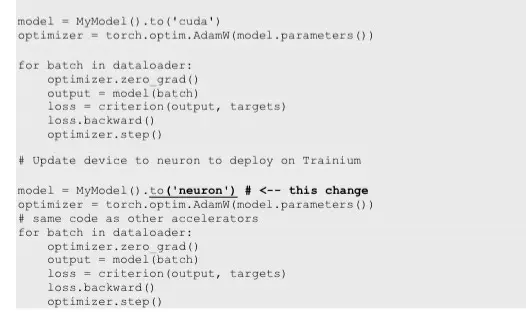
TorchNeuron is intended to let much of that code run with minimal changes. At a basic level, the device transfer can change from .to("cuda") to .to("neuron"), while most PyTorch ATen operators are expected to work. PyTorch’s hardware-agnostic torch.accelerator API could also reduce device-specific code, including for BF16 autocasting. Some PyTorch APIs and research projects still call torch.cuda.* directly, however, so compatibility depends on how the codebase is written.
AWS is prioritizing a dependable BF16 training path before adding TorchAO MXFP8 support. That sequencing fits the needs of many academic and research teams working in areas such as robotics, biotech, world models and self-driving, where BF16 is widely used. Large labs that train with MXFP8 often have kernel specialists who can develop custom implementations; broader support for ordinary research workflows is a different problem.
The ecosystem around PyTorch also matters. Projects such as Hugging Face Transformers, PEFT, diffusers, TRL, Accelerate and TorchTitan are part of what makes PyTorch useful in practice. The Trainium stack already supports several of these, including Hugging Face Accelerate and TorchTitan. TorchTitan is a widely used open-source pretraining framework, and some labs use forks of it as the base for internal training systems.
Trainium is also moving toward support in the vLLM and SGLang communities, with hardware access and early SGLang work built on TorchNeuron. The value of those projects is partly the surrounding adoption: users often turn to established engines when they want new open-source models to run soon after release. A hardware backend that fits into those workflows can reach more users than a standalone engine, even as coding tools make it easier to build software from scratch.
TorchTitan training tests
Testing the stack on a substantial model provides a better sense of the workflow than a small demonstration. The evaluation used Qwen3-32B on 16 Trainium2 chips, configured as 64 logical cores at LNC=2, and also tried a rack-scale Trainium3 UltraServer with 64 physical chips. The reported throughput figures are for the Trainium2 run.
Using Neuron’s official TorchTitan image, the team launched training without setup problems. Eager mode reached an average of 11,099 tokens per second at 23.89% model FLOP utilization (MFU). Compiled mode delivered 14,156 tokens per second at 30.47% MFU, a 1.28× throughput increase over eager mode. The team also made a small change to the model architecture in the modeling code and reported that it worked.
For research, peak throughput is only part of the picture. An experiment often changes the architecture, and the accelerator needs to handle a useful range of operations and shapes without making each iteration a porting project. The early results point to a stack that can support this kind of exploration, though they don’t establish performance across every model or modification.
A separate test used Neuron’s gpt-oss 20B training recipe, which integrates with TorchTitan’s experimental GraphTrainer. The recipe includes Trainium-compatible SimpleFSDP configurations, a compilation backend for capturing PyTorch computation graphs, and custom NKI kernels for attention and mixture-of-experts (MoE) operations. It worked out of the box in this test.
One gap is TokenSwitch, PyTorch’s first-class API for MoE dispatch and combine operations. The report estimates that these communication operations can account for 60–70% of communication volume in MoE training and inference. Trainium currently uses a TorchTitan-specific dispatcher, NeuronEPTokenDispatcher, instead. The AWS team has committed to work with the Meta PyTorch team on changes to TokenSwitch’s abstract interface so it can support Trainium.
Compilation time is the more immediate usability problem. In the Qwen3-32B run, the first step took 184.6 seconds in eager mode and 255.7 seconds in compiled mode—30 to 55 times the average step time after startup. The gpt-oss 20B recipe took 27 minutes and 17 seconds to compile. A long wait at the start of a run adds real friction when researchers are repeatedly testing architecture changes.
The Neuron compiler was shaped in part by inference, where compilation can happen offline and compiled artifacts can be cached for production. Training changes the calculation: compilation delay is part of the researcher’s iteration loop. AWS says upcoming TorchNeuron releases will bring a new compiler backend, more precompiled NKI kernels and a redesigned compilation stack. The stated goal is to cut time to first step by up to two orders of magnitude, with minimal or no performance regression. That improvement remains a target until it is measured in released software.
Matrix multiplication and attention coverage
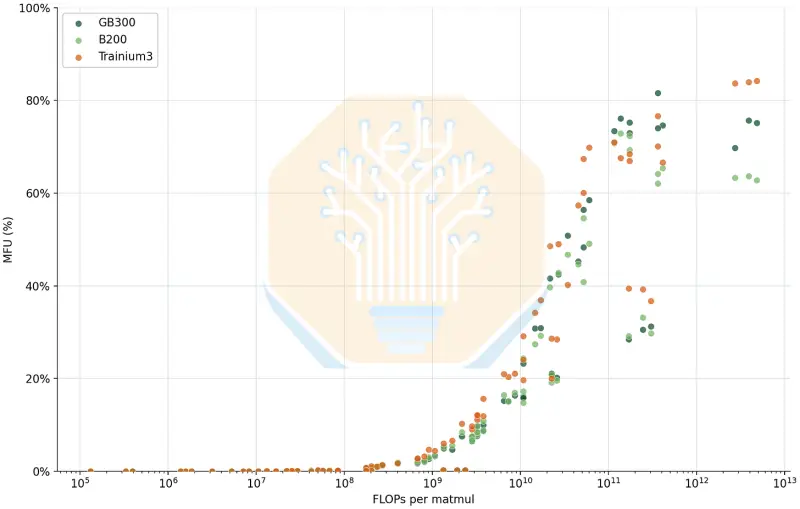
Training research needs reasonable performance across a spread of tensor shapes, since batch sizes and model designs vary. The team benchmarked PyTorch’s nn.functional.linear on one Trainium3 logical core at LNC=2 and compared it with Nvidia GB300 and B200 GPUs. The tested shapes represented projection operations in major open-weight models, with the matrix dimension M set to 1, 128 and 2048 to represent different batch-size scenarios.
In those measurements, Trainium3 showed higher MFU than GB300 from the mid-range, beginning around matrix multiplications requiring 1 GFLOP. GB300 and B200 moved ahead after 100 GFLOP, while Trainium3 led again beyond 1 TFLOP. These results describe the tested shapes and setup; they aren’t a general ranking across all workloads. Their relevance is that Trainium3 performed competitively across parts of the range that researchers may encounter while experimenting.
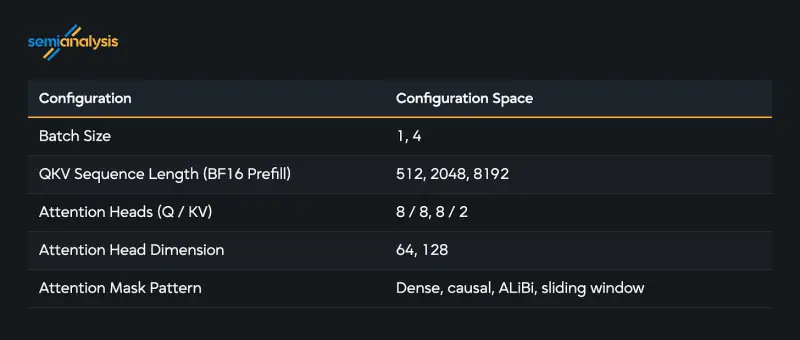
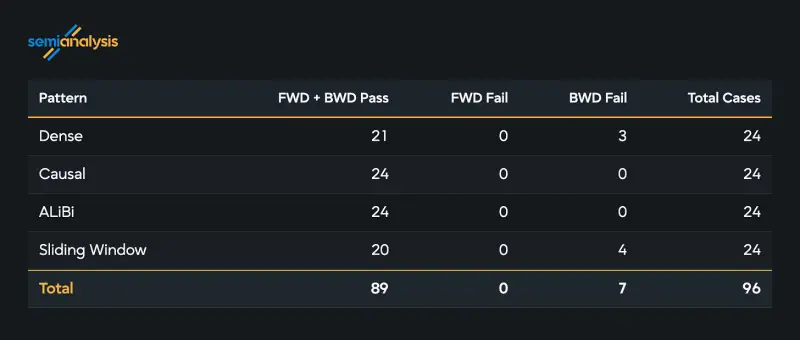
FlexAttention offers another view of how well the stack handles changes to model computation. The PyTorch API lets users express different attention variants and generates the backward pass, with the aim of combining flexibility and useful performance. On the Meta attention-gym benchmark suite, Trainium3 passed 89 of 96 cases, for a 93% pass rate.
All seven failures involved batch size 4 and sequence length 8192. They failed because compilation exceeded the test’s time budget, not because of numerical errors. The team also implemented attention variants outside the benchmark suite and found that their numerical results matched those on Nvidia GPUs. AWS expects later TorchNeuron versions to address the compilation-related failures.
Quality checks across a broad model set
Training support requires more than making a forward pass run. The stack must handle backward passes, precision behavior and many operator combinations across different architectures. An operator can also fall back to CPU execution or trigger a graph break, which may affect performance even when a model completes successfully. Numerical errors are another concern: acceptable throughput does not help if the resulting tensors or training trajectory diverge.
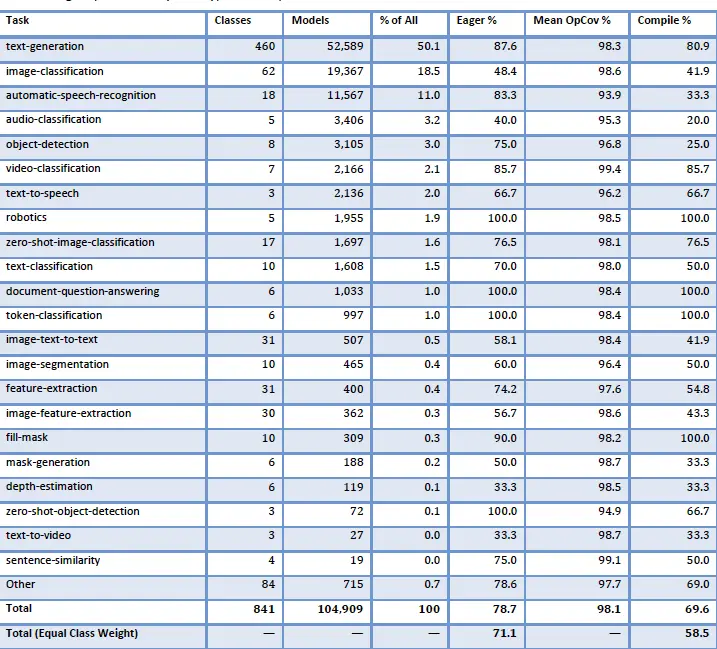
AWS says it tests against a collection of more than 100,000 Hugging Face models spanning normalization methods, MLP and MoE layouts, and attention types. Its checks cover crashes, performance, CPU fallbacks, missing native support and graph breaks. They also compare numerical results with CPU and Nvidia baselines, including tensor-level parity and loss-curve divergence.
The quality-control effort uses up to 80,000 physical cores for automated testing. The assessment reports that Trainium’s pass rates have not reached 100%, but it sees progress and clear reporting of remaining gaps as useful signs. Automated checks matter because a training stack has to maintain both numerical correctness and usable performance across a large set of models—not just deliver a favorable result on a carefully chosen benchmark.
Neuron Explorer’s fine-grained view
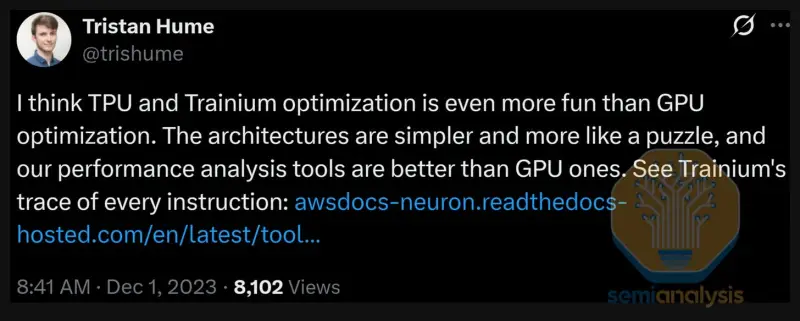
Neuron Explorer is the strongest part of the Trainium software experience described in these tests. The team’s initial view is that its hardware-aware, event-based timeline makes accelerator behavior easier to inspect than the profiling tools they used for Nvidia and AMD. That judgment comes from hands-on experience and does not amount to a benchmark of every profiler or workload.
Getting started takes some work. Kernel profiling and PyTorch profiling use similar but slightly different setups, with environment variables, output file types and capture commands to keep track of. The tested kernel workflow was to start a persistent Neuron Explorer server, capture a kernel trace with the neuron-explorer capture command, then upload the trace to the server as an artifact through a web request. The team asked AWS for clearer documentation explaining why each setting is needed and what the different files contain.
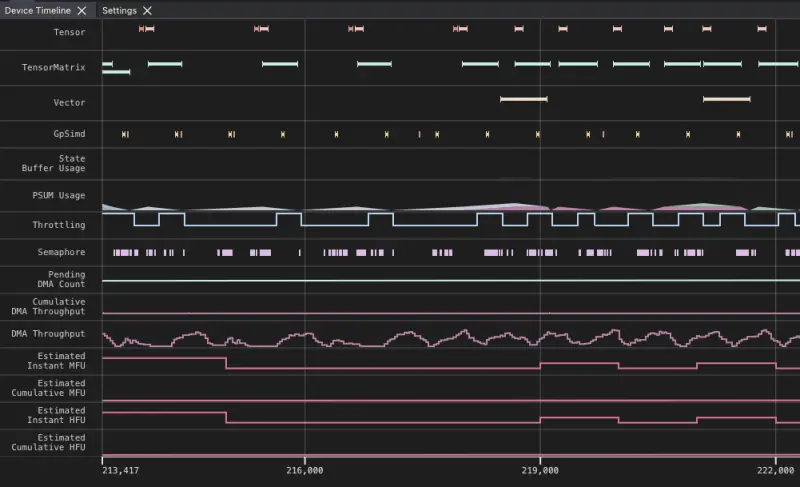
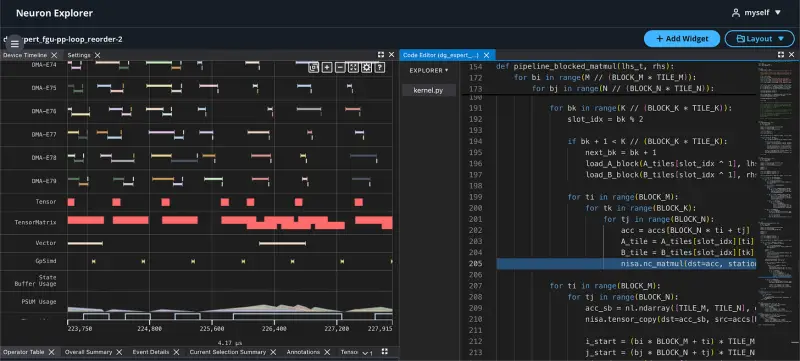
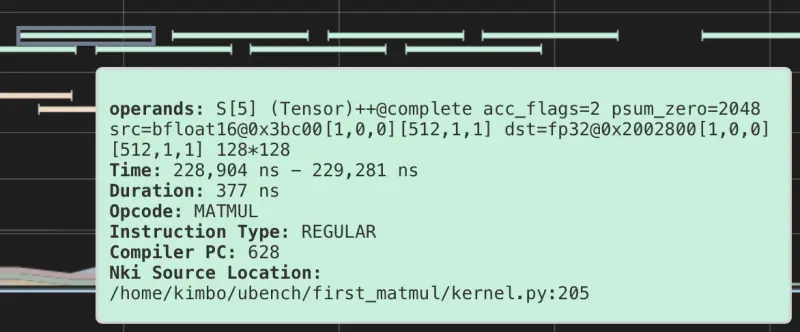
After setup, the timeline presents hardware units in separate rows, making idle gaps visible at a glance. That layout helps a performance engineer see whether computation overlaps with memory transfers. The viewer also shows dependencies: selecting a block highlights its flow dependencies, ordering dependencies and downstream relationships in different colors. This gives users a direct way to reason about which events constrain other work.
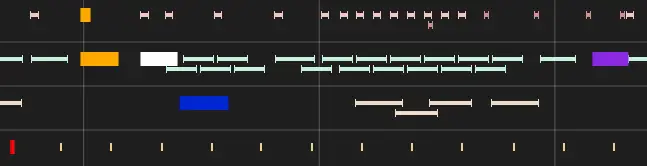
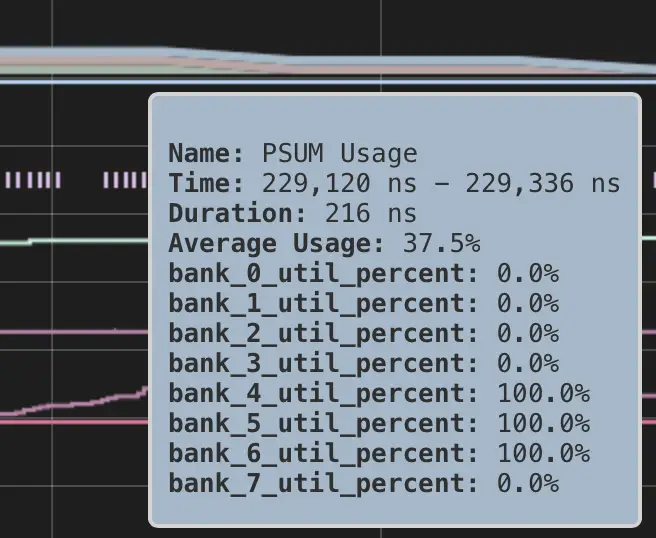
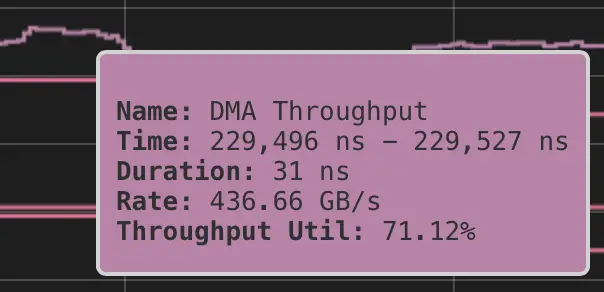
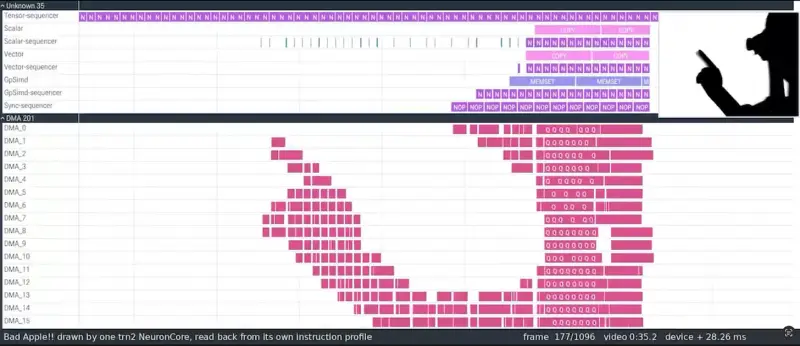
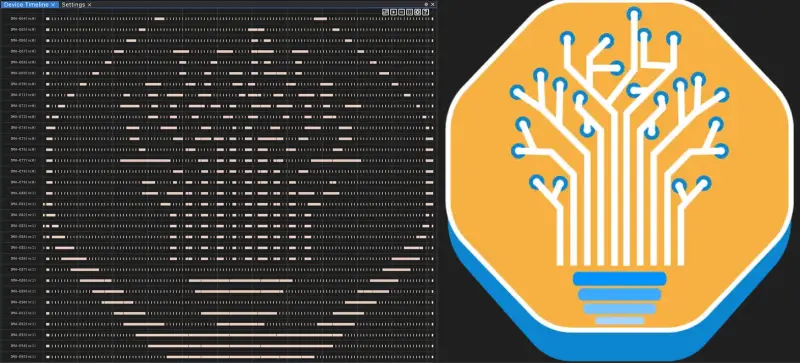
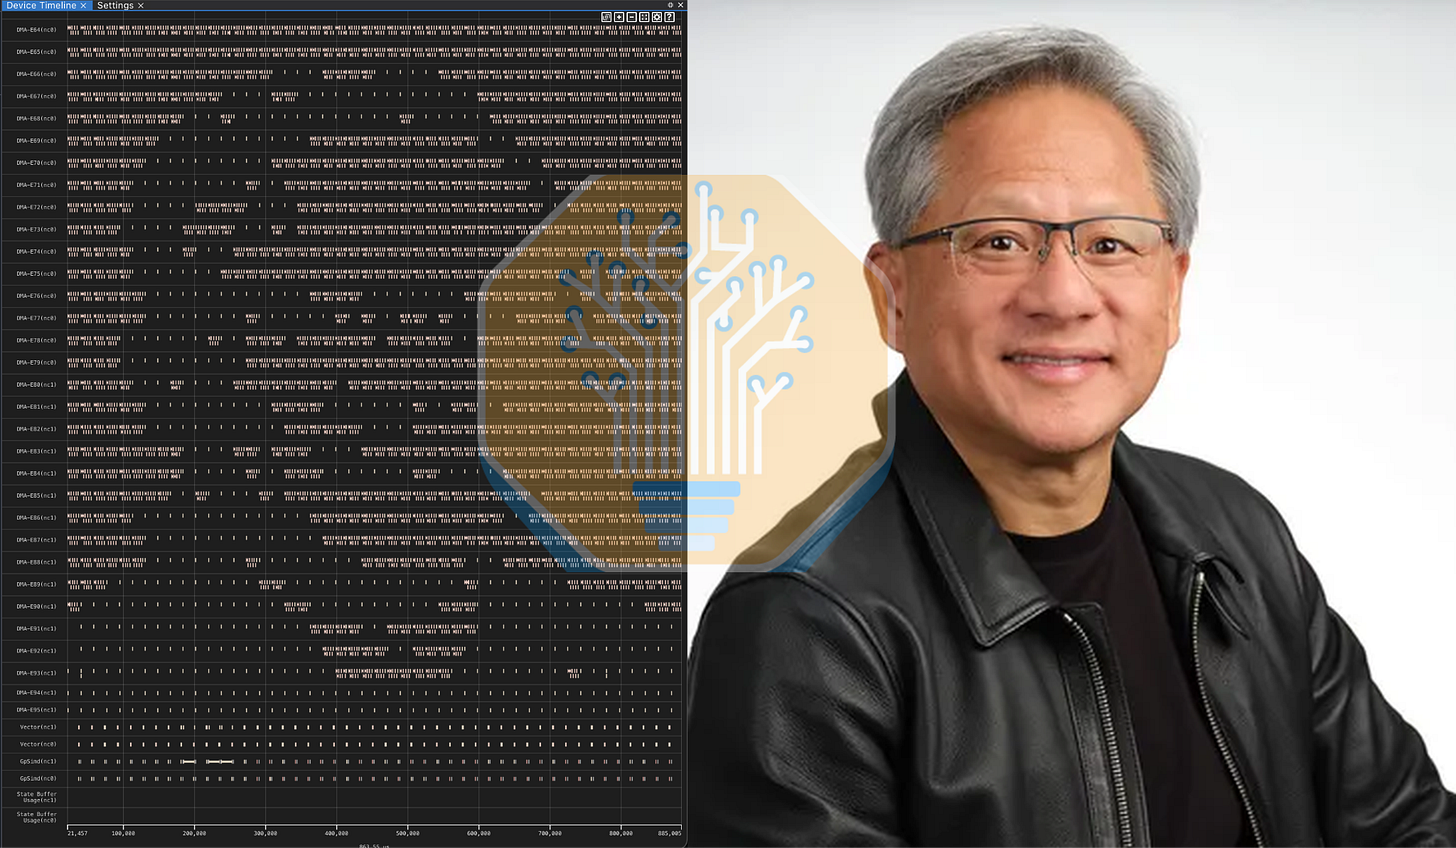
The tool also maps events back to code and shows event details, memory-bank utilization and memory throughput at microsecond resolution. The supplied examples use actual traces from Trainium hardware. The team even used the profiler’s fine-grained control of DMA activity to create pixel art: Trainium has 16 DMA engines per physical core, and the images were made by activating engines to shade regions, with the shaded width set by how much data each engine moved.
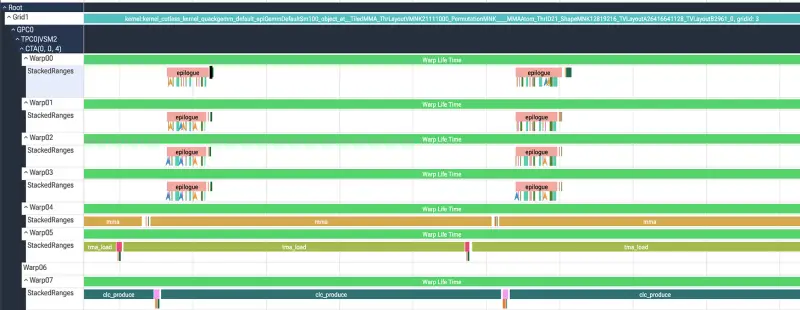
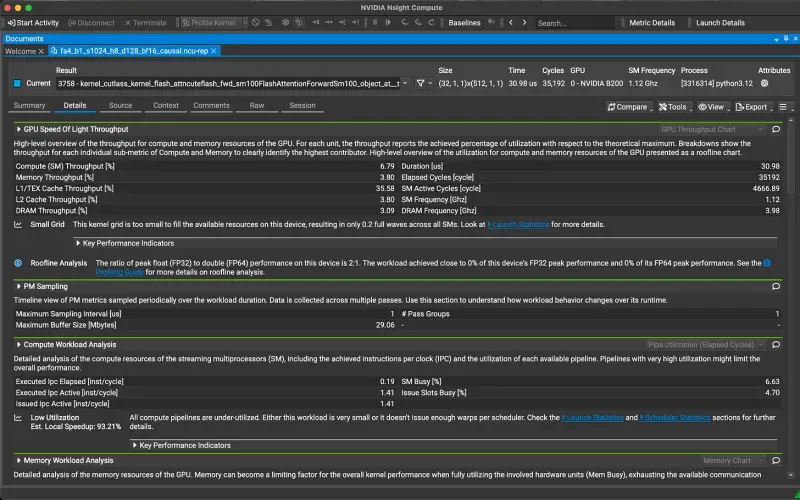
This is more than a novelty. The same resolution that can render images can help engineers inspect activity inside a kernel. The comparison in the tests is with Nvidia’s Nsight Compute, which emphasizes aggregate metrics and performance details rather than an event-based intra-kernel timeline. QuACK, an intra-kernel profiler associated with Tri Dao, uses Nvidia’s In-Kernel Event Tracing API and can render traces through Perfetto, but requires custom work to set that up. Neuron Explorer puts this style of view directly into a hardware-specific tool.
For teams evaluating Trainium, the profiler could make performance investigation more approachable once the capture workflow is clear. The larger adoption question is whether the native PyTorch path can keep pace with researchers’ changing models while compilation delays fall and library support expands. Trainium3’s early training results are encouraging; the software’s day-to-day value will depend on turning that progress into a fast, predictable loop for experimentation.



 AMD Venice Uses 2.5D Packaging to Feed More Bandwidth Into EPYC Zen 6
 CNC Controller Board Design: Interfaces, PCB Specs and Assembly Testing
 Stratasys and Nano Dimension End $42.5 Million Markforged Sale Agreement